> For the complete documentation index, see [llms.txt](https://docs.clearfeed.ai/clearfeed-help-center/llms.txt). Markdown versions of documentation pages are available by appending `.md` to page URLs; this page is available as [Markdown](https://docs.clearfeed.ai/clearfeed-help-center/clearfeed-helpdesk/insights.md).
# Insights
View analytics for requests, tickets, Virtual Agent, and AI Agent usage
Insights provides reports for request volume, response times, service levels, and AI usage. Use **All Requests** (or **All Tickets** for Internal Helpdesk) for request and ticket metrics. Accounts using the legacy experience show **Answers** interaction metrics. On accounts using the current AI Agents experience, **Virtual Agent** replaces **Answers** and reports Virtual Agent sessions, while **AI Agents** reports usage across every interface. You can filter reports, save custom reports, and export data for further analysis.
**Use Insights to answer questions like:**
* Which channels experience the highest request volumes?
* How quickly are responders resolving requests on average?
* How effectively is the Clearfeed Virtual Agent reducing manual workloads?
* Which interfaces account for your billed AI Agent sessions?
## Supported Metrics
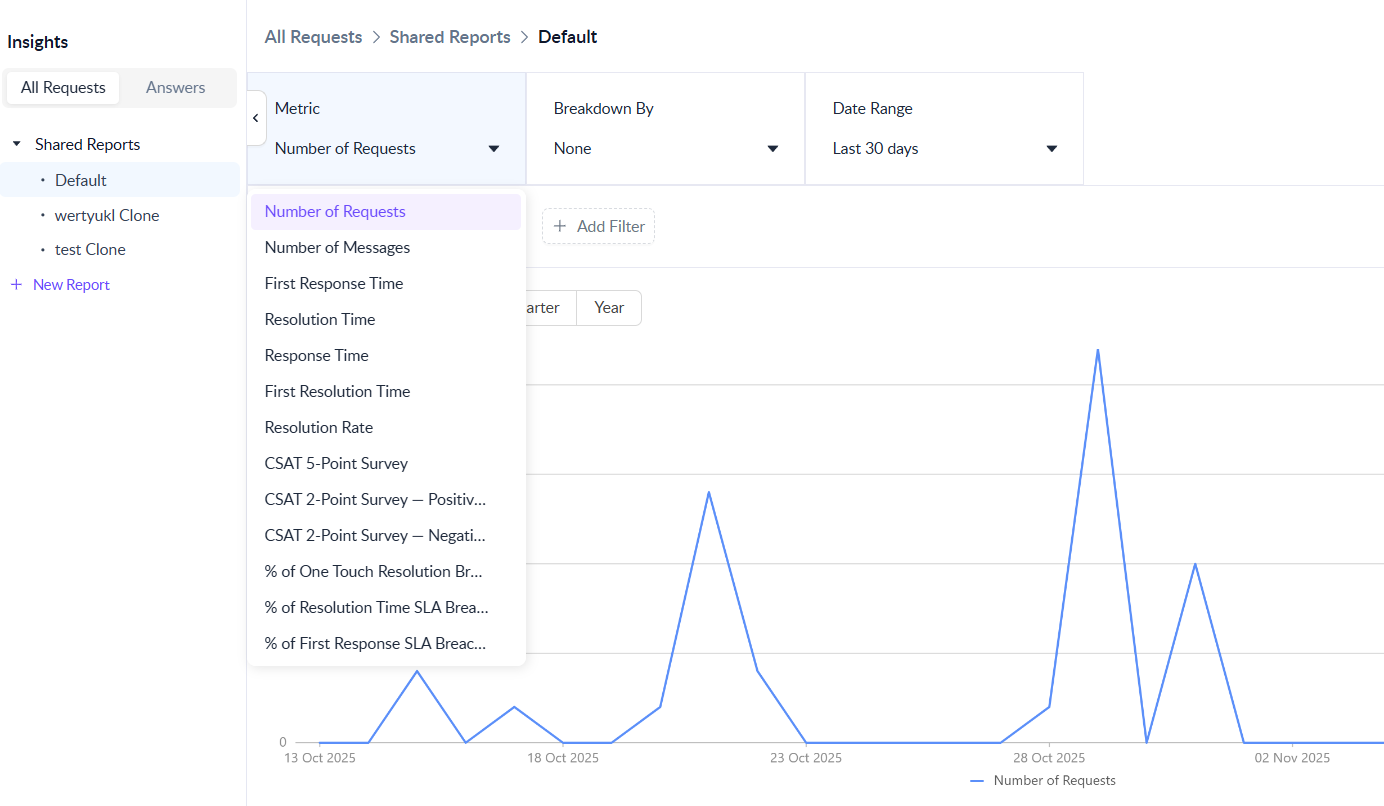
We support metrics across **Requests, Tickets, Answers, Virtual Agent, and AI Agents**. You can:
* Select the metrics you want to track.
* Break them down by parameters such as **Collection, Channel, Assignee, Custom Fields**, **Customer, Customer Owner, Customer Custom Fields** and more.
* Apply a **date range** to analyze performance over time.
{% hint style="info" %}
You can break down any metric using up to **3 dimensions**, available in **tabular reports only**.
{% endhint %}
{% hint style="warning" %}
**For Internal Helpdesk Only**
* Metrics such as **Number of Requests**, **Response Time**, and **Resolution Time** are calculated **only for tickets**. Messages that are **not converted into tickets** are **not included** in these metrics.
* Clearfeed **by default** calculates the key metrics like **First Response Time, Response Time, Resolution Time and First Resolution Time** from the moment a **request is initially created**, even if a ticket is created later. If your team prefers to calculate these metrics **starting from when a ticket is created** (rather than from request creation), this is supported as an optional configuration. To enable this, please **contact the Clearfeed Support team**. **Important Notes About This Configuration**
* **Only affects future tickets**: Switching this setting **does not retroactively update** metrics for existing tickets. Metrics for past tickets will remain based on request creation time.
* **Non-Open Tickets**: If a ticket is created in a **non-open state**, **First Response Time** will **not apply**, and the ticket **won’t be included** in First Response metrics.
* **Account-wide setting**: This change applies at the **account level** — affecting **all collections** and all related metrics (**Response Time**, **Resolution Time**, etc.).
{% endhint %}
| Virtual Agent | AI Agents |
| --------------------------------------------------------------------------------------------------- | -------------------------------- |
| [Number of Sessions](#number-of-sessions) | [Number of Sessions](#ai-agents) |
| [Number of Sessions where Virtual Agent Answered](#number-of-sessions-where-virtual-agent-answered) | |
| [Answer Rate](#answer-rate) | |
| [Number of Deflected Sessions](#number-of-deflected-sessions) | |
| [Deflection Rate](#deflection-rate) | |
| [Number of Sessions with Positive Feedback](#number-of-sessions-with-positive-feedback) | |
| [Number of Sessions with Negative Feedback](#number-of-sessions-with-negative-feedback) | |
### For All Requests/Tickets
{% hint style="info" %}
Use the toggle **Request with a ticket** to see metrics for tickets *(this is only applicable for users under Product Edition External Helpdesk and Integrations)*.
{% endhint %}
#### **Number of Requests**
* Total requests initiated during the selected period; excludes earlier requests with messages in the period.
* Toggle 'Requests with Tickets' to view insights for ticket-based requests.
* **Example:** 10 requests initiated today, even if work continued on 4 older requests, the count is still 10.
* **Reporting Unit:** Number
{% hint style="success" %}
This metric is termed as **Number of Tickets** under the Internal Helpdesk
{% endhint %}
#### **Number of Messages**
* Total Slack messages (from responders, requesters, or others) within the selected time frame.
* Excludes bot messages not whitelisted by ClearFeed.
* Includes messages from requests initiated before the selected period.
* **Reporting Unit:** Number
#### **Time to First Response**
* Average time from request creation to the first responder’s reply (e.g., 👀, :ticket:).
* Excludes open requests with no response; only counts responses within business hours.
* **Example:** A 9:00 AM request responded at 9:30 AM has a 30-minute first response time.
* **Reporting Unit:** Average in minutes.
#### **Response Time**
* Average time between a requester’s message and the next responder reply, including first and subsequent responses.
* Excludes open requests with no responses; business hours (support pending).
* **Example:** If a first response is 4 mins and next is 8 mins, average response time = 6 mins.
* **Reporting Unit:** Average in minutes.
#### **Resolution Time**
* Average time from request initiation to marking it as "Solved," excluding unresolved requests.
* Adjusted for business hours to exclude non-working periods
* Adjusted to omit time spent in **Pending**, **On Hold**, or both states when Resolution Time pausing is configured in [Business Schedule & SLA](/clearfeed-help-center/clearfeed-helpdesk/sla-management.md#pausing-resolution-time).
* First Response Time is never paused by this setting; only Resolution Time is affected.
* **Example:** A request raised at 8 AM and solved at 9:30 AM on a 9–5 schedule = 30 mins resolution time.
* **Reporting Unit:** Average in minutes.
#### **First Resolution Time**
* Time from request creation to its first resolution, unaffected by subsequent reopening.
* Excludes unresolved requests; adjusted for business hours.
* **Example:** A 10:00 AM request solved at 10:30 AM = 30 mins first resolution time.
* **Reporting Unit:** Average in minutes.
#### **Resolution Rate**
* The percentage of requests that have been marked as resolved out of the total requests received.
* **Formula:** `(Number of Closed/Resolved Requests ÷ Total Requests) × 100`
* **Example:** If 80 out of 100 requests were resolved, the Resolution Rate = 80%.
* **Reporting Unit:** Percentage (%)
### CSAT Metrics
**Note:** CSAT metrics are aggregated based on the time the survey is triggered (i.e., when the request is marked as solved) - not when the request was created or when the response was submitted.
#### **CSAT 5-Point Survey**
*Available when CSAT Type is set to “Emoji Rating”*
* Displays the **average satisfaction score (1–5)** from requesters for solved tickets.
* Requests without CSAT feedback are excluded.
* Toggle **‘Requests with Tickets’** to view only ticket-based scores.
* *Example:* Ratings of 1, 3, and 5 result in an average score of 3.
* **Reporting Unit**: Average score
#### **CSAT 2-Point Survey - Positive Responses**
*Available when CSAT Type is set to “Thumbs Up/Down Rating”*
* Shows the **count of positive (👍)** responses from requesters on solved tickets.
* Toggle **‘Requests with Tickets’** to view only ticket-based scores.
* **Reporting Unit**: Count of positive responses
#### CSAT 2-Point Survey - Negative Responses
*Available when CSAT Type is set to “Thumbs Up/Down Rating”*
* Shows the **count of negative (👎)** responses from requesters on solved tickets.
* Toggle **‘Requests with Tickets’** to view only ticket-based scores.
* **Reporting Unit**: Count of negative responses
### SLA Metrics
#### **% of First Response SLA Breached**
* % of requests breaching the SLA for first response, adjusted for business hours.
* **Example:** 10 requests with 6 breaches = 60% breach rate.
* **Reporting Unit:** Percentage (%).
#### **% of Resolution Time SLA Breached**
* % of requests breaching SLA for resolution time, excluding unresolved or non-request messages.
* **Example:** 10 resolved requests with 6 breaches = 60% breach rate.
* **Reporting Unit:** Percentage (%).
#### **% One Touch Resolution Breached**
* % of requests breaching "One Touch SLA" (e.g., resolution in a set number of replies).
* Excludes non-request messages; unaffected by business hours.
* **Example:** 10 solved requests with 6 breaches = 60% breach rate.
* **Reporting Unit:** Percentage (%).
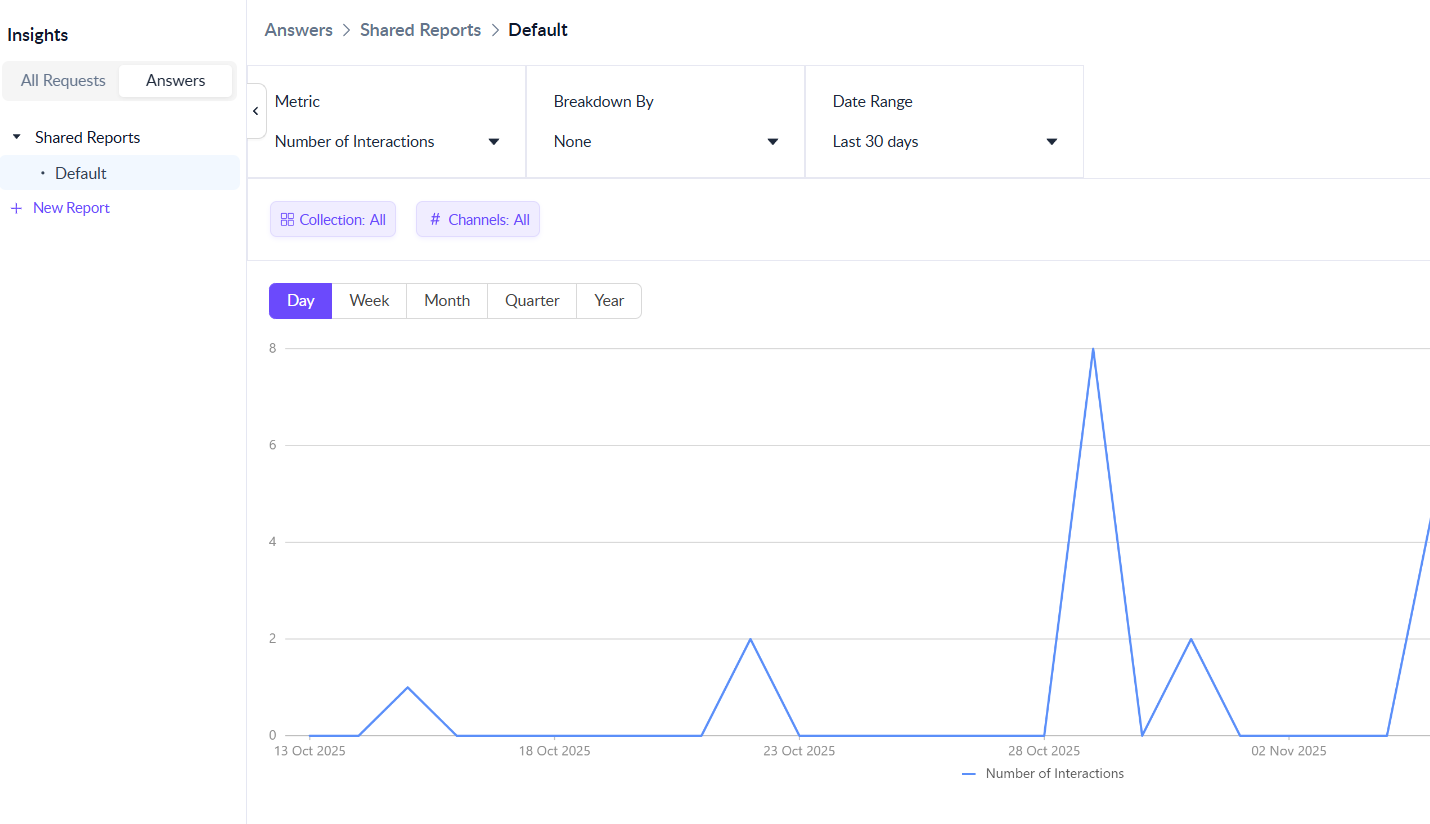
### Answers Metrics
#### **Number of Interactions**
* Tracks how often the Virtual Agent is triggered, including responses (generated answers, search results) and no-response instances.
* Each trigger counts as one interaction, even if it includes multiple response types.
* **Example:** 10 triggers = 4 generated answers + 3 search results + 3 no responses; total = 10 interactions.
* **Reporting Unit:** Number.
#### **Number of Responses**
* Captures instances where the Virtual Agent responded with generated answers or search results.
* Excludes triggers where no response is found.
* **Example:** 10 triggers = 4 generated answers + 3 search results + 3 no responses; total = 7 responses.
* **Reporting Unit:** Number.
#### **Number of Generated Answers**
* Counts instances where the Virtual Agent responded specifically with generated answers.
* Excludes responses from search results or no-response triggers.
* **Example:** 10 triggers = 4 generated answers; total = 4 generated answers.
* **Reporting Unit:** Number.
#### **Number of Positive Feedback**
* Tracks how often users selected "Yes, marked as solved" for Virtual Agent solutions.
* Excludes instances with no feedback provided.
* **Example:** 10 triggers = 5 positive + 2 negative feedback + 3 no feedback; total = 5 positive feedback.
* **Reporting Unit:** Number.
#### **Number of Negative Feedback**
* Tracks how often users selected "No, create a ticket" for Virtual Agent solutions.
* Excludes instances with no feedback provided.
* **Example:** 10 triggers = 5 positive + 2 negative feedback + 3 no feedback; total = 2 negative feedback.
* **Reporting Unit:** Number
### Virtual Agent Metrics
ClearFeed exposes the following metrics to help you measure AI Agent performance, effectiveness, and customer satisfaction:
#### **Number of Sessions**
Total count of Virtual Agent sessions that were created. This metric represents Virtual Agent activity only. Use the **AI Agents** tab to view billed AI usage across all interfaces.
#### **Number of Sessions where Virtual Agent Answered**
Sessions where the AI Agent provided a response intended to resolve the user’s request.
#### **Answer Rate**
Percentage of AI Agent sessions where the AI Agent provided an answer intended to resolve the user’s request.
* **Formula:** Answer Rate = `(Number of Sessions where Virtual Agent Answered ÷ Number of Sessions) × 100`
* **Example:** 80 answered sessions out of 100 total sessions = 80% Answer Rate.
* **Reporting Unit:** Percentage (%).
* If there are no AI Agent sessions in the selected period, this metric is shown as **N/A**.
#### **Number of Deflected Sessions**
Sessions where the AI Agent successfully deflected the request.\
A session is marked as *deflected* when the user clicks **“Yes, mark as solved.”**
#### **Deflection Rate**
Percentage of AI Agent sessions that were successfully deflected.
* **Formula:** Deflection Rate = `(Number of Deflected Sessions ÷ Number of Sessions) × 100`
* **Example:** 60 deflected sessions out of 100 total sessions = 60% Deflection Rate.
* **Reporting Unit:** Percentage (%).
* If there are no AI Agent sessions in the selected period, this metric is shown as **N/A**.
#### **Number of Sessions with Positive Feedback**
Sessions where users provided positive feedback by selecting **“Yes, mark as solved”** or **“Yes, helpful.”**
#### **Number of Sessions with Negative Feedback**
Sessions where users selected **“No, create a ticket”** or **“Not helpful”**, indicating the AI response did not resolve their need.
### AI Agents Metrics
The **AI Agents** tab shows the AI Agent sessions included in usage reporting across all customer-facing interfaces. It provides one metric: **Number of Sessions**.
Internal test sessions and sessions created while drafting a reply are excluded because they aren't reported as billed usage.
Use **Breakdown By** to group sessions by:
* **Interface**
* **Collection**
* **Channel Name**
The **Interface** breakdown includes:
* Virtual Agent
* Agent Assistant
* ClearBot Assist
* Message Bar
* Bot Mention, including public and private mentions
* Automation
An **Other** category can appear for an uncategorized interface. Interface counts always add up to the total session count.
Collection and channel breakdowns include sessions linked to a request. Sessions without a linked request remain in the total, so these breakdowns might not add up to the total session count.
Filter the report by collection, channel, or date range. You can also save the report as a custom report and reopen it with the same metric, breakdown, and filters.
{% hint style="info" %}
The **AI Agents** tab is available only for accounts on the current AI Agents experience. If the tab isn't available, a direct AI Agents report link opens **All Requests** (or **All Tickets** for Internal Helpdesk) instead.
{% endhint %}
## Aggregation
* You can aggregate metrics in three different ways for detailed reporting and insights:
* Average
* Median
* Percentile: Metrics can be aggregated for the 75th, 90th, and 95th percentiles.
* Aggregation options are available for the following metrics:
* First Response Time
* Response Time
* First Resolution Time
* CSAT Score
* For other metrics, the default aggregation method is Average.
Supported Aggregation in ClearFeed
### Breakdown By and Distribute By
**Breakdown By for request metrics**—Split a request metric by single-select fields such as Assignee, Status, Priority, Collection, Customer, single-select custom fields, or native AI fields (Auto-CSAT, Auto-Emotion). This option isn't available for multi-select fields. Use up to 3 dimensions in tabular reports. For the **AI Agents** metric, use the Interface, Collection, and Channel Name breakdowns described above.
For accounts with custom statuses enabled, the **Status** filter and **Status** breakdown include each custom status under its parent category. Use the filter to query a specific custom status. When you break down a report by **Status**, charts, tables, dashboard report cards, and CSV exports show standard and custom statuses as separate results. For example, **Open** and its custom status **Yet to Start** appear separately. If custom statuses are disabled, Insights groups results by standard status.
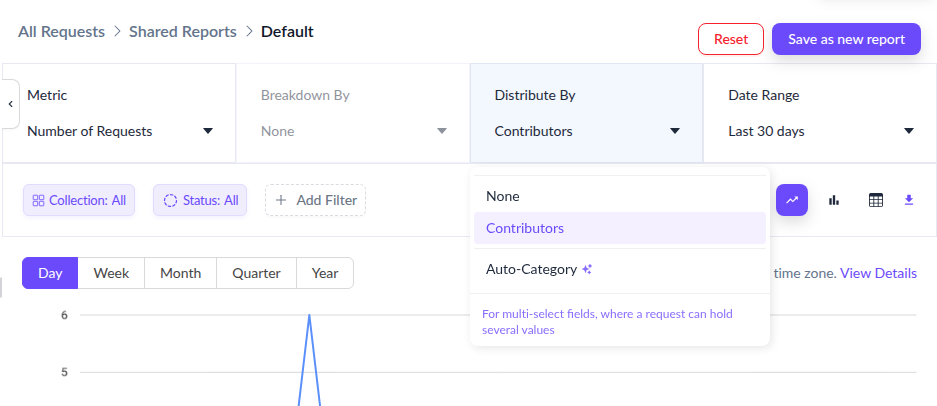
**Distribute By**—Distribute request counts across multi-select fields. This option is available only for the **Number of Requests** metric. Available fields include Contributors, Auto-Category, and multi-select custom fields. One request can appear under multiple values, so sums may exceed total requests.
Insights report with Distribute By set to Contributors
When **Distribute By** is enabled, **Breakdown By** is disabled, and vice-versa.
## **Export Data**
ClearFeed supports data export/download in CSV format. The data can be exported by clicking the button highlighted below:
To export the data via APIs, the following methods can be used:
* Use the Insights REST API as documented here: [Insights API Documentation](https://docs.clearfeed.ai/api/reference/api-reference/insights).
* Import Insights Data into a Google Sheet using the [Insights to Google Sheet Guide](/clearfeed-help-center/advanced-recipes/importing-insights-data-into-google-sheets.md).
## Standard Reports
ClearFeed creates a set of standard Insights reports by default so teams can quickly open commonly used metrics without building reports from scratch. These reports appear under **Shared Reports** and use the last 7 days as the default date range.
On the **All Requests** tab (or **All Tickets** for Internal Helpdesk), default reports can include:
* **Open Requests**: Open request volume over time.
* **Requests by Assignee**: Request volume grouped by assignee.
* **Requests Volume**: Request volume grouped by customer for customer inboxes, or by channel for other helpdesks.
* **Avg First Response Time**: Average first response time over time.
* **Avg Response Time**: Average response time over time.
* **First Response SLA Breach**: First response SLA breach percentage, shown when first response SLA tracking is configured.
* **CSAT Score**: Customer satisfaction score or positive CSAT responses, shown when CSAT is enabled.
On the **Virtual Agent** tab, default reports can include:
* **Sessions**: Virtual Agent session volume over time.
* **Deflection Rate**: Percentage of Virtual Agent sessions that were deflected.
* **Negative Feedback Sessions**: Virtual Agent sessions with negative feedback.
{% hint style="info" %}
The exact standard reports available in your account depend on your ClearFeed edition and configuration. For example, SLA and CSAT reports appear only when those features are configured, and integration-focused accounts may see a generic **Default** report instead.
{% endhint %}
## Custom Reports
You can save your frequently used filter combinations as a custom report to access specific data without reapplying complex filters each time. Start from a standard report, an existing custom report, or a new report setup.
### Creating a New Custom Report
You can create a new custom report from scratch or use an existing report as the starting point.
#### **Option 1: Using an existing Report**
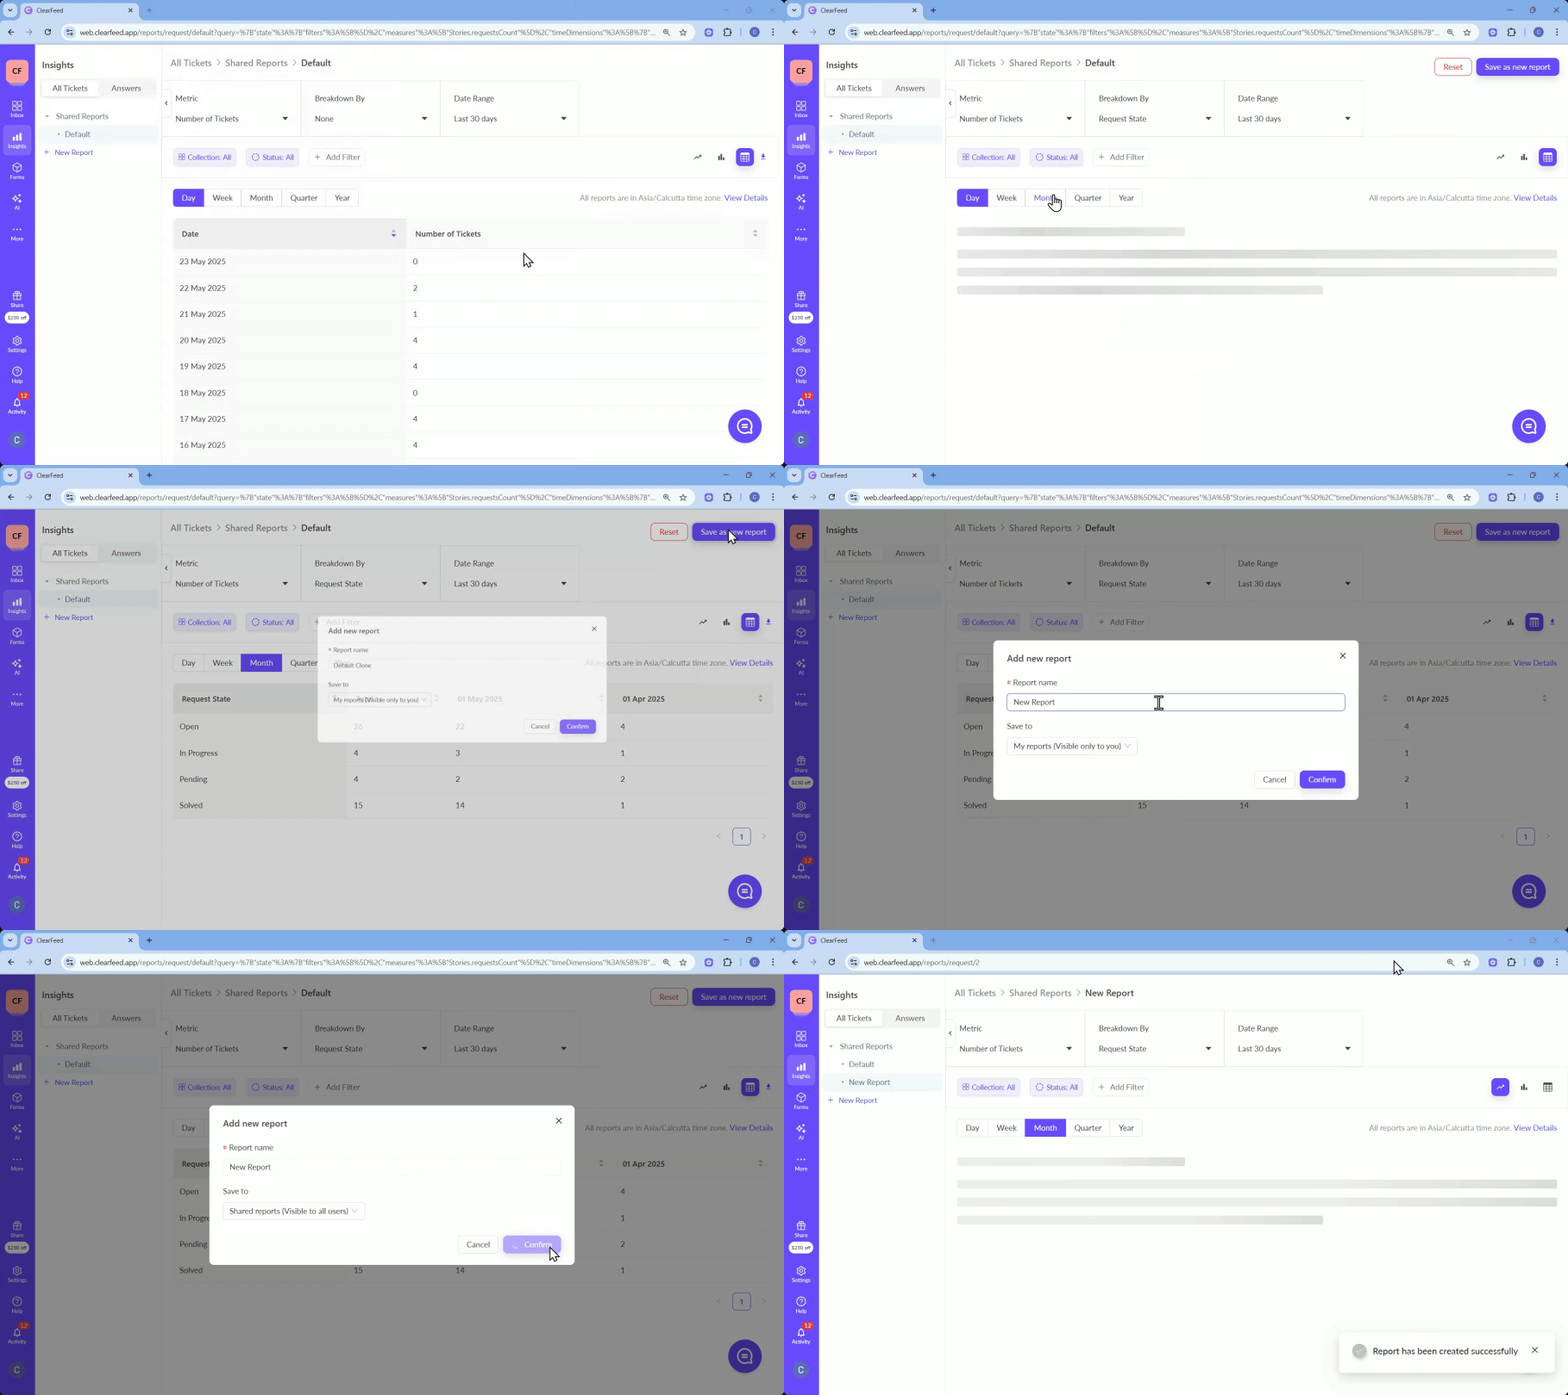
1. Start with an existing standard or custom report and update it by:
* Changing the metric
* Changing the breakdown
* Editing or removing existing filters
* Changing the date range
2. Once the desired filters are applied:
* Click **Save as New Report** to create a new report
* Click **Save Report** to update the existing report
3. In the **Save As** overlay that appears:
* Enter a name for your new report
* Choose the visibility (Admins only):
* **My Reports**: Visible only to you
* **Shared Reports**: Visible to all users in your account
4. Click **Save** to create the report
5. You will be redirected to your newly created report
#### **Option 2: Clone an Existing Report**
1. Identify the report you want to clone
2. Click the three dots (**⋮**) next to that report
3. Select **Clone Report**
4. In the popup:
* Enter a name for the new report
* Choose the visibility
5. The cloned report will be created, and you will be redirected to it
6. Optionally, edit the filters or make changes to the report as needed and click **Save Report**
### Managing Custom Reports
#### **For Reports Created by You**
If you have created a custom report, you can:
* **Rename**: Change the name of the report.
* **Clone**: Duplicate the report to create a new one.
* **Delete**: Remove the report permanently.
#### **For Shared Reports You Didn’t Create**
For reports under **Shared Reports** that you didn’t create, you can:
* **Clone**: Use the existing report as a template to create your custom report.
## FAQs
1. **Does Insights support timezone customization for reports?**\
**Answer:** Yes, all reports in Insights follow the default timezone set in **Account Settings**. You can update the timezone anytime by navigating to **Account Settings → SLA Settings**.
2. **Which type of custom fields are available for Breakdown By and Distribute By?**\
**Answer:** Use **Breakdown By** with single-select custom fields. Use **Distribute By** with multi-select custom fields for the **Number of Requests** metric.
3. **Does Resolution Time calculation exclude time spent in Pending or On Hold?**\
**Answer:** Yes, if **Pause Resolution Time** is enabled under **Settings → Additional Settings**. Admins can configure ClearFeed to exclude time spent in **Pending**, **On Hold**, or both states from Resolution Time. This pause setting does not affect First Response Time.
.png?alt=media)
.png?alt=media)
.png?alt=media)